What Is a Good HRV? Normal Ranges by Age, Sex and Device (2026)
There is no universal good HRV: healthy adults average about 42 ms RMSSD in short resting ECG recordings, falling from about 40 ms in the late 20s to about 20 ms after 55, with a wide spread. Apple Watch has long reported SDNN while Oura, Whoop and Garmin report overnight RMSSD, so compare each device only with your own 7-day trend and act on sustained drops, not single nights.
What Is a Good HRV? Normal Ranges by Age, Sex and Device (2026)
By the HealthPerk Editorial Team · Last updated: October 2026
Quick Answer
What is a good HRV for my age?
A good HRV is one at or above your own usual baseline, not one universal number. For context, healthy adults average about 42 ms RMSSD in short resting ECG recordings (range 19–75 ms). Averages fall with age, from about 40 ms in your late 20s to about 20 ms after 55.
| Your situation | First step |
|---|---|
| You just got a wearable and want to know if your number is "good" | Wear it every night for 3 weeks to build a personal baseline before judging anything |
| Your HRV dropped sharply for one night | Check for alcohol, a late meal, a hard workout, or poor sleep, and look again after 2–3 nights |
| Your 7-day average is below your normal range for several days | Swap hard training for easy sessions and prioritize sleep until it recovers |
| Your Apple Watch number is lower than a friend's Oura or Whoop number | Don't compare: Apple has long reported SDNN, while Oura, Whoop and Garmin report overnight RMSSD |
| Low HRV comes with chest pain, fainting, palpitations, or breathlessness | Seek medical care. Call 911 for chest pain or fainting |
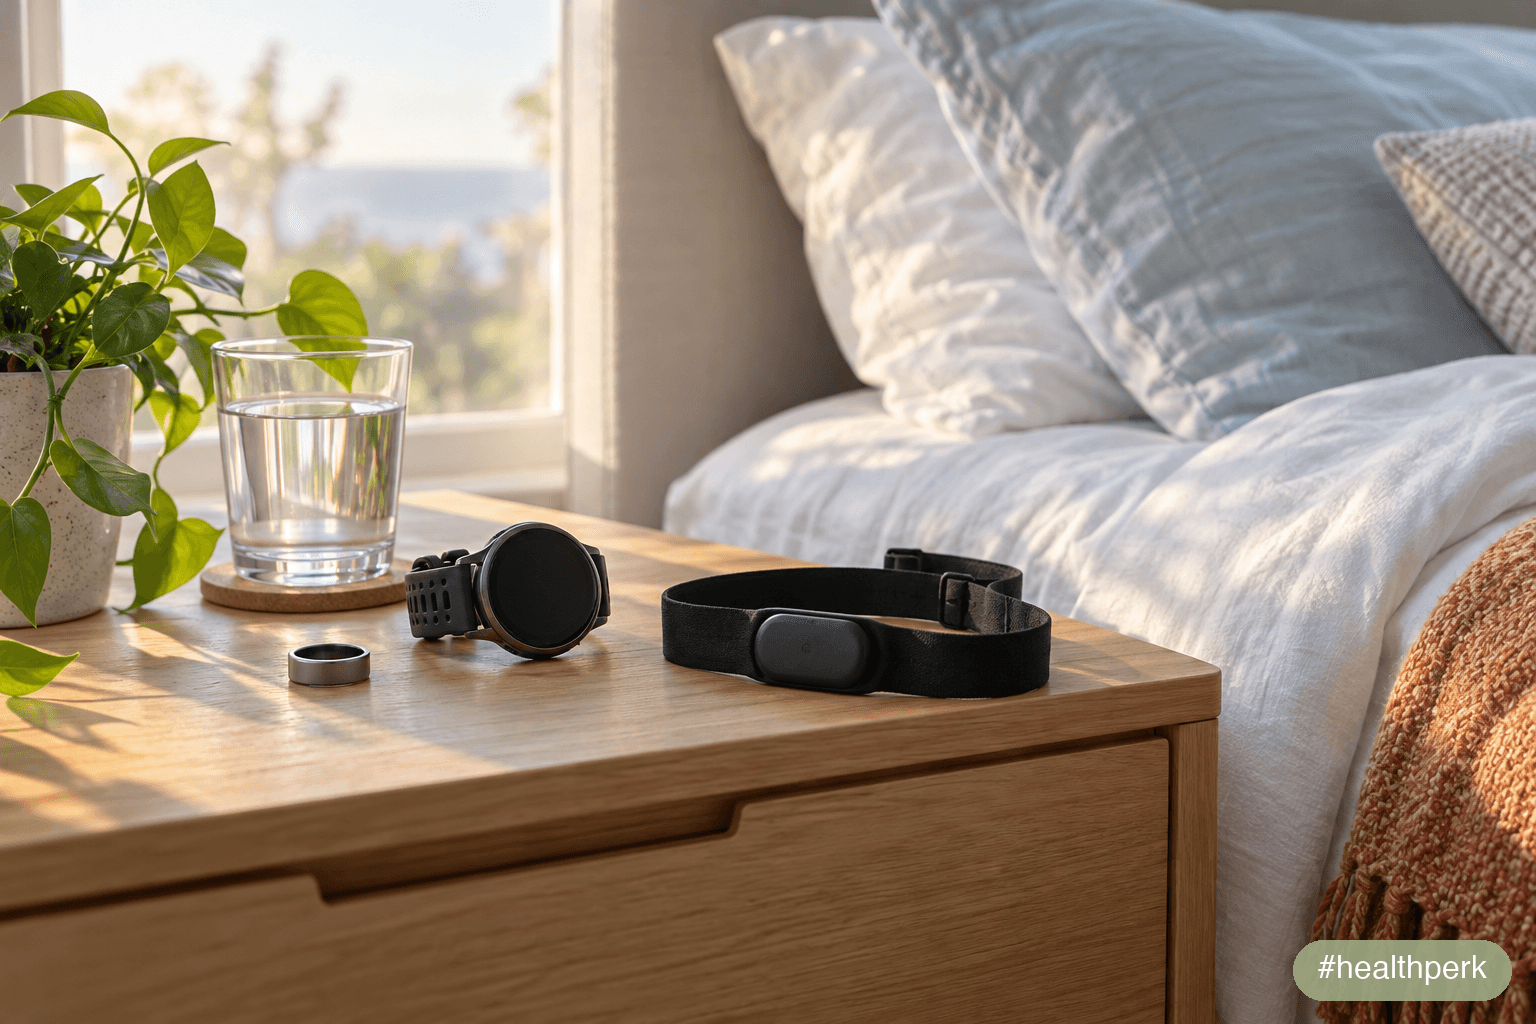
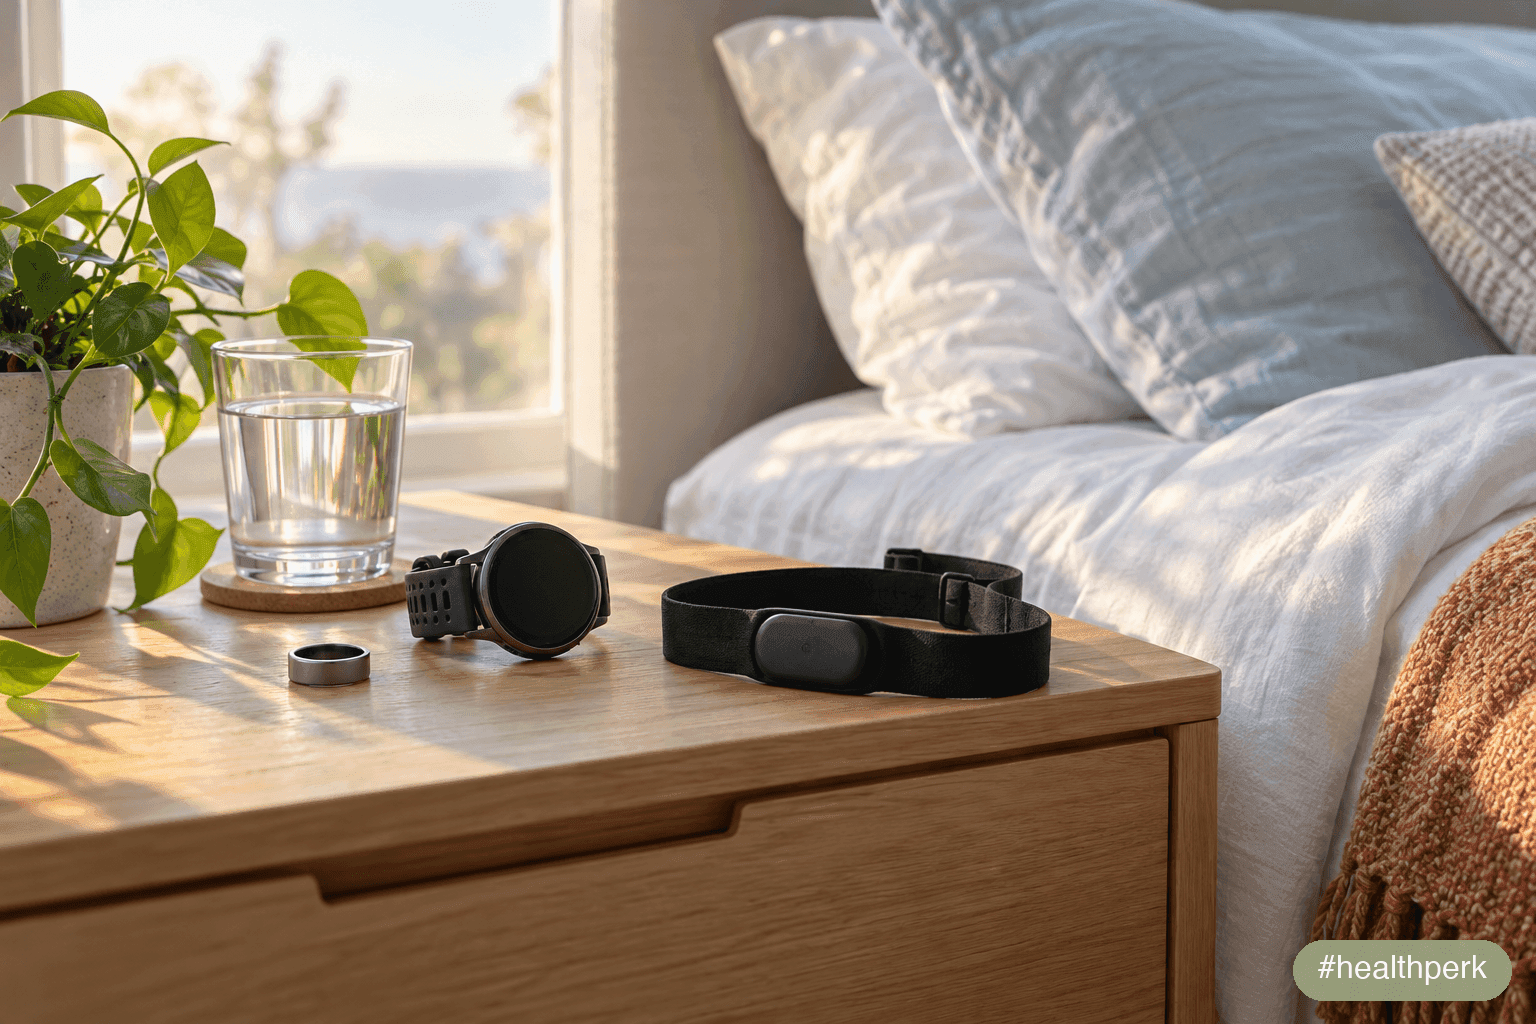
Rings, watches and chest straps all estimate heart rate variability, but they use different formulas and time windows.
What is a good HRV? It's the question almost every new wearable owner asks after seeing a number like 38 ms or 72 ms in their app. The honest answer has two parts. Population data tell you what is typical for your age and sex. Your own baseline tells you what is normal for you, and that is the number that matters for daily decisions.
This guide gives you both. It explains what heart rate variability (HRV) measures, why RMSSD and SDNN produce different numbers, and what published data show for each decade of adult life. It also covers how Apple Watch, Oura, Whoop and Garmin calculate HRV, including Apple's September 2026 changes. Finally, it shows how to use your trend for training decisions and when a low number deserves a doctor's attention.
Table of Contents
- What HRV Actually Measures (and Why It Drops)
- RMSSD vs SDNN: Why Your Numbers Don't Match
- Normal HRV by Age and Sex: What the Data Shows
- So, What Is a Good HRV for You?
- How Apple Watch, Oura, Whoop and Garmin Measure HRV
- What Lowers and Raises HRV
- Which HRV Tracking Approach Is Right for You?
- How to Use HRV for Training Decisions: A Step-by-Step Plan
- Common HRV Myths, Corrected
- When to See a Doctor
- Related Articles on Health Perk
- Frequently Asked Questions
- References
What HRV Actually Measures (and Why It Drops)
Your heart doesn't beat like a metronome. At a resting rate of 60 beats per minute, one gap between beats might be 980 milliseconds and the next 1,030. HRV is the size of those beat-to-beat fluctuations, measured in milliseconds [1][2].
Those fluctuations come mostly from the tug-of-war between the two branches of your autonomic nervous system. The parasympathetic branch acts through the vagus nerve. It slows the heart within a beat or two, and its influence rises and falls with each breath: the heart speeds up slightly as you inhale and slows as you exhale. The sympathetic branch (the "fight or flight" side) acts more slowly and tends to make the rhythm faster and more regular [1][2].
When you are rested and relaxed, vagal input is strong and the gaps between beats vary more, so HRV is higher. Stress, illness, heavy training, alcohol and poor sleep all shift the balance toward sympathetic activity. The rhythm becomes more uniform and HRV falls. That's why HRV works as a sensitive (though non-specific) signal of how much load your body is dealing with.
Two points help when you read your own data:
- HRV is a marker, not a cause. Low HRV is associated with higher cardiovascular risk. A meta-analysis of 21,988 people without known heart disease found that the lowest SDNN group had a 32–45% higher risk of a first cardiovascular event [28]. But that is an association. Raising your number by itself isn't proven to lower risk [29].
- HRV depends on context. Recording length, body position, breathing, time of day, age and sex all change the value. Researchers stress that 24-hour, 5-minute and sub-5-minute HRV values are not interchangeable [2].
RMSSD vs SDNN: Why Your Numbers Don't Match
Most of the confusion about what counts as normal comes from two formulas that both get labeled "HRV."
RMSSD (root mean square of successive differences) looks at the change from one beat to the next. It squares each successive difference, averages them and takes the square root. Because it captures fast, beat-to-beat changes, it is the main time-domain measure of vagally mediated HRV [2]. Oura, Whoop and Garmin all report HRV as RMSSD [16].
SDNN (standard deviation of normal-to-normal intervals) measures the overall spread of all the intervals in a recording. It reflects both parasympathetic and sympathetic influences and grows with recording length. A 24-hour SDNN is much larger than a 5-minute SDNN for the same person [1][2]. Apple's HealthKit has stored Apple Watch HRV as SDNN since iOS 11 [11].
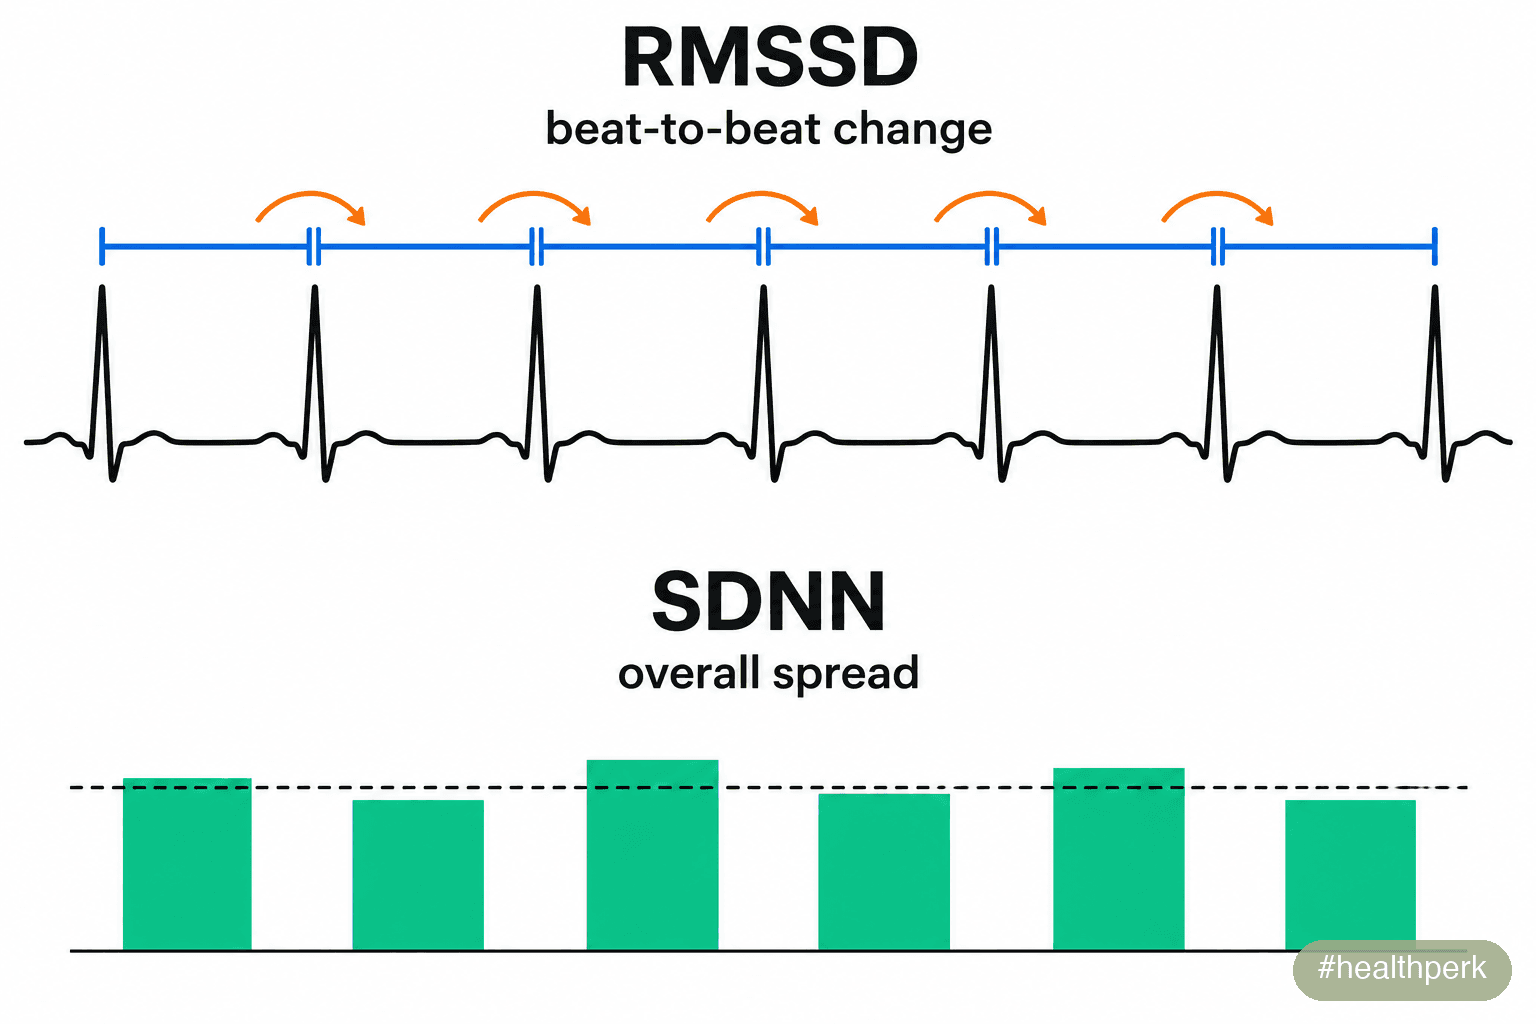
Schematic, not real data: RMSSD tracks the change between neighboring beats, while SDNN measures how widely all intervals spread around their average.
What this means in practice:
- A 45 ms RMSSD and a 45 ms SDNN are not the same result.
- A night-time average from a ring isn't comparable with a one-minute daytime reading from a watch.
- Charts that don't say which metric, recording length and time of day they used are close to meaningless.
Wearables also don't measure your heart's electrical signal. Most use photoplethysmography (PPG): an optical sensor detects pulse waves in the skin, and the device calculates intervals between pulses. That works well when you are still, which is one reason most devices focus on readings taken during sleep [13][16].
Normal HRV by Age and Sex: What the Data Shows
The most useful published norms come from controlled ECG recordings, not wearables. Two sources matter most.
Pooled adult norms. A 2010 systematic review by Nunan and colleagues combined 44 studies of 21,438 healthy adults. For short (about 5-minute) resting recordings, mean RMSSD was 42 ms (SD 15; range of study means 19–75 ms) and mean SDNN was 50 ms (SD 16; range 32–93 ms) [3][2]. These values were lower than the original 1996 Task Force reference figures.
Norms by decade and sex. A 2015 PLoS One study from the German KORA cohort recorded 5-minute supine ECGs in 1,906 healthy adults aged 25 to 74 (782 women, 1,124 men) [4]. It is one of the clearest age-and-sex breakdowns available.
Normal HRV by age and sex (5-minute resting ECG, mean ± standard deviation)
| Age | RMSSD, men (ms) | RMSSD, women (ms) | SDNN, men (ms) | SDNN, women (ms) |
|---|---|---|---|---|
| 25–34 | 39.7 ± 19.9 | 42.9 ± 22.8 | 50.0 ± 20.9 | 48.7 ± 19.0 |
| 35–44 | 32.0 ± 16.5 | 35.4 ± 18.5 | 44.6 ± 16.8 | 45.4 ± 20.5 |
| 45–54 | 23.0 ± 10.9 | 26.3 ± 13.6 | 36.8 ± 14.6 | 36.9 ± 13.8 |
| 55–64 | 19.9 ± 11.1 | 21.4 ± 11.9 | 32.8 ± 14.7 | 30.6 ± 12.4 |
| 65–74 | 19.1 ± 10.7 | 19.1 ± 11.8 | 29.6 ± 13.2 | 27.8 ± 11.8 |
Source: Voss et al., 2015, KORA S4 cohort, supine 5-minute ECG after 5–10 minutes of rest [4]. All-adult pooled reference: RMSSD 42 ± 15 ms, SDNN 50 ± 16 ms (Nunan et al., 2010) [3].
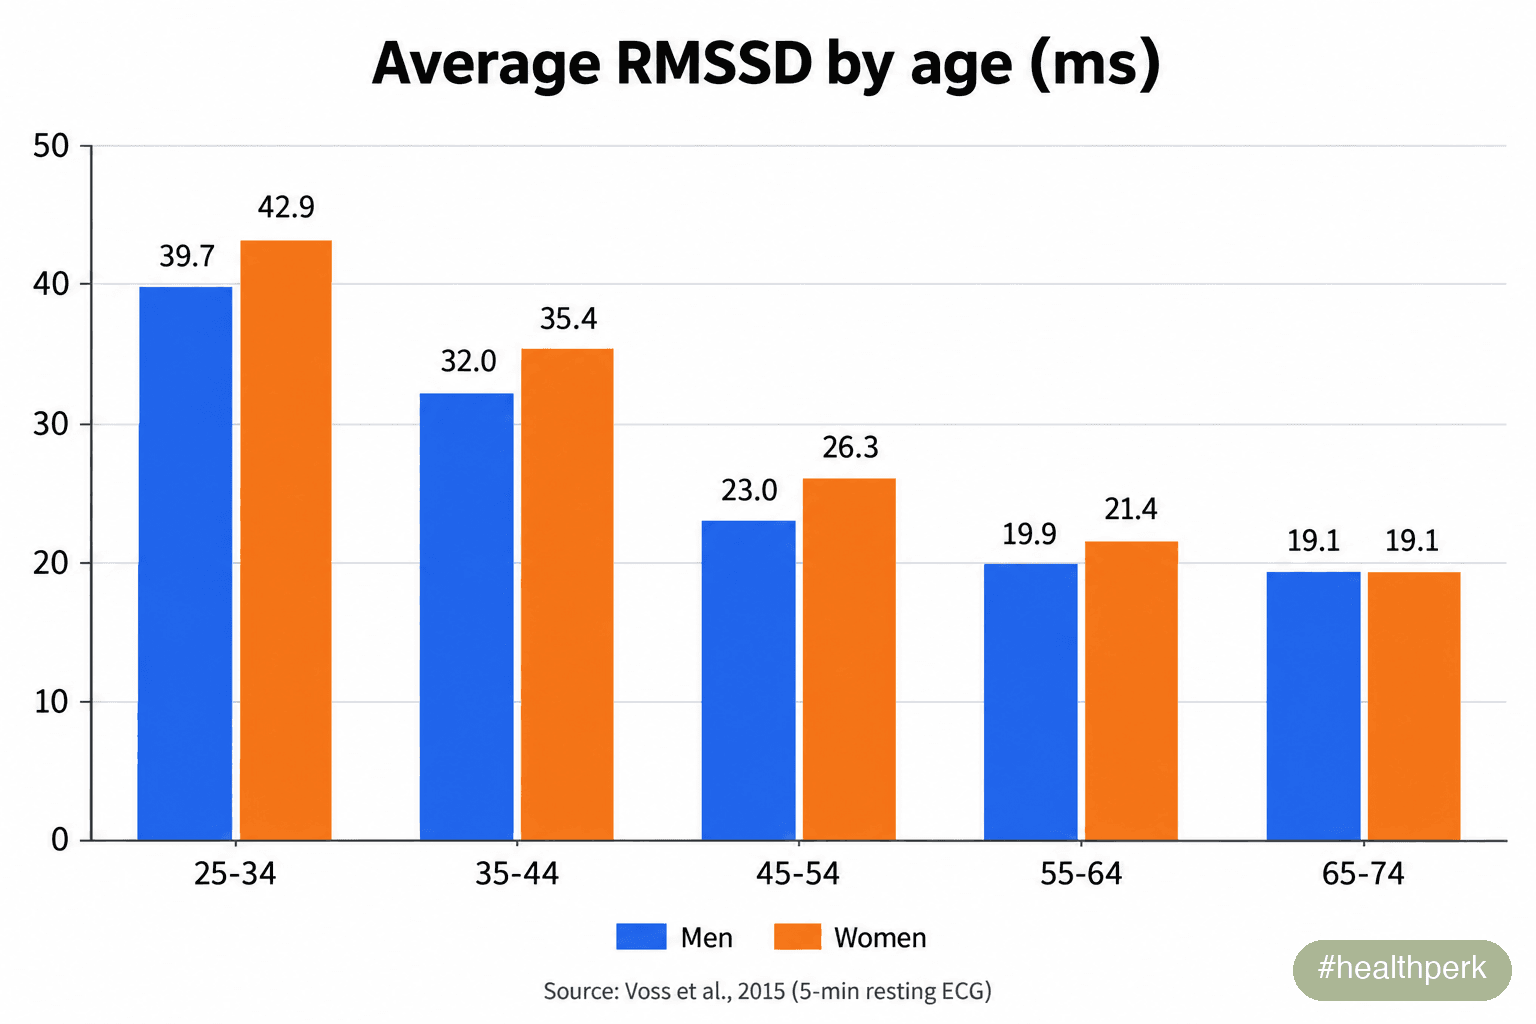
Average resting RMSSD by decade for men and women, plotted from the Voss et al. (2015) KORA data.
Four patterns stand out:
- The spread is wide. In every age group, the standard deviation is about half the mean. Two healthy 30-year-olds can easily differ by 30 ms or more.
- RMSSD falls fastest in early and middle adulthood. In a 24-hour study covering nine decades, RMSSD fell to 47% of its second-decade value by the sixth decade and then stabilized [5]. The KORA data show the same shape, with the steepest drop between the late 30s and mid 50s [4].
- Sex differences are small and depend on the metric. In KORA, men and women didn't differ significantly in RMSSD or SDNN in any decade [4]. Across 172 studies, women showed lower SDNN but higher high-frequency (vagal) power than men [7].
- Wearable datasets show the same direction. An analysis of 8,203,261 Fitbit users found that HRV declines with age and shows strong variation by time of day. RMSSD did not differ meaningfully by sex [6]. WHOOP reports from its member data that the middle half of 25-year-old men fall roughly between 50 and 100 ms, versus about 35–60 ms at 45 [30]. Those are company figures based on overnight readings, so they run higher than daytime ECG norms.
So, What Is a Good HRV for You?
Population tables answer "Is my number unusual?" They can't answer "Am I recovered today?" For that, you need your baseline.
A practical way to read your number:
- Compare against your own age group only as a rough check. Use the same metric. If your overnight RMSSD from a ring is 25 ms at age 30, it sits in the lower part of the range. If it's 25 ms at 60, it's slightly above the KORA average for that decade. Remember that night-time wearable values often run higher than the daytime ECG figures in the table.
- Judge your trend, not a single night. Oura's own guidance is to compare your current HRV only against your own historical trends, not against other people [13].
- Know the normal noise. In a WHOOP validation study, night-to-night variation in log-transformed RMSSD was substantial [17]. A small dip after one bad night is usually just noise; compare against your own baseline on the same device.
- Use the same device and conditions. Switching from a watch to a ring, or from a morning reading to an overnight average, resets your baseline.
Bottom line: a good HRV is one that is stable or rising within your personal range over weeks, measured the same way each time. A number that is persistently and unusually low for your age is worth discussing with a clinician, especially if it comes with symptoms.
How Apple Watch, Oura, Whoop and Garmin Measure HRV
Apple Watch: SDNN, and a September 2026 split into two HRV types
For years, Apple Watch has taken short background HRV readings throughout the day and night and stored them in the Health app as SDNN [11]. The Health app shows the raw values without a normal range. In a 2018 validation against a Polar chest strap in 20 healthy volunteers, Apple Watch beat-to-beat interval data showed very good reliability (above 0.9). Gaps in the data didn't significantly affect time-domain HRV [19].
On September 9, 2026, Apple announced Apple Watch Series 12, which measures HRV "up to 24 times more often." It splits HRV into two variants: Recovery HRV, for daily signals of stress and recovery, and overall HRV, for broader health insights including cardiovascular health. Overnight vitals now compare Recovery HRV against your personal baseline, and HRV feeds a new 0–10 Readiness score [9]. Readiness is available only on Series 12 and Ultra 4. It needs you to sleep with the watch on at least 7 of the past 49 nights [10].
Apple hasn't said which formula Recovery HRV uses. HealthKit did add a new heartRateVariabilityRMSSD data type in iOS and watchOS 27, alongside the long-standing SDNN type [11][12]. Until Apple documents it, don't compare Apple's new numbers directly with Oura, Whoop or Garmin.
Oura, Whoop and Garmin: overnight RMSSD
- Oura takes 5-minute samples throughout the night and shows the average of all samples taken while you sleep [13][16]. In a home study of 35 adults, its nightly RMSSD closely matched ECG [18].
- Whoop describes its value as a dynamic average during sleep, weighted toward your last slow-wave sleep stage [16].
- Garmin averages HRV across the sleep period [16]. Its HRV Status compares your 7-day average with a personal baseline built over 3 weeks. It labels the result Balanced, Unbalanced, Low, or Poor ("well below the normal range for your age") [14][15].
For a head-to-head of the two most popular recovery wearables, see our Oura vs Whoop comparison.
HRV wearables compared
| Device | HRV metric | When it measures | What it compares you against | Independent accuracy data (overnight HRV vs reference) |
|---|---|---|---|---|
| Apple Watch (through Series 11) | SDNN | Short background readings, day and night | Raw values in Health; no range shown | Beat intervals reliable at rest (>0.9) in 20 adults [19] |
| Apple Watch Series 12 / Ultra 4 | Recovery HRV + overall HRV (formula not published) | Up to 24× more often; overnight vitals | Personal baseline; Readiness needs 7 of 49 nights [9][10] | No independent validation yet |
| Oura (Gen 3, Gen 4) | RMSSD | Whole night, 5-minute samples averaged | Your own historical trend [13] | Highest agreement: CCC 0.97–0.99, error about 6–7% [16] |
| Whoop 4.0 | RMSSD | Sleep, weighted toward last slow-wave sleep | Your recent baseline | Moderate: CCC 0.94, error about 8% [16] |
| Garmin (Fenix 6 tested) | RMSSD | Whole sleep period averaged | 7-day average vs 3-week baseline [14] | Lower: CCC 0.87, error about 10.5% [16] |
| Chest strap + morning app reading | Usually RMSSD | 1–5 minutes on waking | Whatever baseline the app builds | ECG-based; used as the reference in validation studies [16] |
CCC = Lin's concordance correlation coefficient (1.0 is perfect agreement). Accuracy figures come from one 2025 study of 13 adults over 536 nights, so treat the ranking as preliminary [16].
Our verdict: For tracking overnight HRV trends, the best independent evidence currently favors Oura, with Whoop close behind. Garmin is less precise night to night, but its 7-day HRV Status smooths much of that noise. Apple Watch data are usable for long-term trends, but the September 2026 changes make old and new Apple numbers hard to compare. If you want the most accurate single reading, a chest strap and a consistent morning routine still beat any optical sensor. Our guide to devices to track heart rate at home covers the strap option.
What Lowers and Raises HRV
| Factor | Typical effect | Evidence |
|---|---|---|
| Alcohol | Lowers overnight HRV, dose-dependently, even at low doses | In 4,098 adults, HRV-based recovery fell by 9.3, 24.0 and 39.2 percentage points after low, moderate and high intake [20] |
| Acute illness | Lowers HRV, sometimes before symptoms | Apple Watch SDNN patterns changed in the 7 days before a COVID-19 diagnosis [21] |
| Sleep deprivation | Lowers RMSSD | Meta-analysis of 11 randomized trials (549 people) [22] |
| Psychological stress | Lowers vagal HRV | Meta-analysis and review of 37 studies [23] |
| Hard training block | Lowers HRV short term; very high values can also follow big load increases | Garmin notes above-baseline HRV after a big jump in training [15]; elite athletes show both patterns [26] |
| Menstrual cycle and hormonal contraception | Higher early in the cycle, lower late; 3–9% swings in time-domain HRV | 2026 living systematic review of 16 studies [8] |
| Regular aerobic exercise | Raises resting vagal HRV over weeks | Meta-analysis of 13 studies [24] |
| Slow breathing (about 6 breaths per minute) | Raises vagal HRV during and right after practice | Meta-analysis of 223 studies [25] |
A few practical notes follow from this table:
- Alcohol is the most reliable single-night HRV crusher. The Finnish study found the effect was similar in men and women, and regular exercise didn't protect against it [20].
- Unexplained drops plus a rising resting heart rate often precede illness. That pattern is a reason to rest and watch for symptoms, not a diagnosis.
- Sleep is the biggest lever you control. Our guide on how to improve sleep quality naturally covers the basics.
- Women should expect cyclical swings. A late-cycle dip of a few percent is normal physiology, not lost fitness [8].
Which HRV Tracking Approach Is Right for You?
The curious beginner. You want to know if your number is "good." Use whatever wearable you already own, wear it nightly for 3 weeks, and compare your average with the age table above using the same metric. Then stop checking daily and look at weekly trends.
The recreational runner or cyclist. You want to adjust training. Choose a device that reports overnight RMSSD and a rolling baseline (Oura, Whoop or Garmin HRV Status), and follow the step-by-step plan below. Pair it with our heart rate zones calculator so easy days are actually easy.
The serious or elite athlete. Single-night wearable values are too noisy for fine decisions. Use a chest strap reading on waking, in the same position every day, and track a 7-day rolling average of log-transformed RMSSD, as sports scientists recommend [26]. Remember that in very fit athletes, both rises and falls in HRV can accompany overreaching [26].
The stressed professional. HRV can show how alcohol, late work and short sleep affect your recovery. Treat it as feedback for habits, not a stress diagnosis. Slow-breathing practice raises HRV in the short term [25]. Our Calm vs Headspace comparison covers guided breathing apps.
The person with a heart condition or on heart-rate-altering medication. Beta-blockers, arrhythmias and pacemakers can all change HRV readings. Share your data with your cardiologist rather than interpreting it alone.
How to Use HRV for Training Decisions: A Step-by-Step Plan
HRV-guided training has real but modest evidence behind it. A 2021 meta-analysis found that adjusting training to daily HRV improved vagal HRV more than a fixed plan (standardized mean difference 0.50). Gains in aerobic fitness and endurance performance were small and not statistically significant [27]. In practice, HRV is most useful for avoiding bad days, not for finding extra performance.
- Pick one measurement method and stick with it. Use either overnight HRV from the same wearable, or a 1–5 minute chest-strap reading right after waking, in the same position, before coffee.
- Build a baseline for at least 3 weeks. Garmin needs 3 weeks of nightly data for HRV Status [14]. Apple's Readiness needs at least 7 of the past 49 nights [10]. Train normally during this period.
- Watch the 7-day rolling average, not single days. Sports scientists recommend weekly averaging because single-day values are noisy [26][27].
- Ignore changes inside your normal band. Night-to-night swings are typical [17]. Most apps show this band as a shaded range.
- Apply simple rules:
- 7-day average within your normal band: train as planned.
- 7-day average below your band for 2–3 days: replace intense sessions with easy aerobic work or rest, and prioritize sleep.
- Sharp drop plus higher resting heart rate, fever or feeling unwell: rest completely and watch for illness.
- Check the obvious causes first. Alcohol, a late heavy meal, travel, a hard workout the day before and the late phase of the menstrual cycle all lower HRV without meaning you are overtrained [8][20].
- Review the long-term trend every 4–8 weeks. A gently rising or stable baseline during steady aerobic training is a good sign [24]. A baseline that keeps sliding over weeks, alongside fatigue and worse performance, suggests too much load or too little recovery.
Common HRV Myths, Corrected
Myth: "Higher HRV is always better." Within your own range, higher usually means better recovery. But a sudden jump well above baseline can follow a big training increase, and Garmin treats it as a sign your body is "working overtime to recover" [15]. Irregular rhythms and extra beats also make HRV look artificially high, which is why ECG standards require removing them [1].
Myth: "I can compare my HRV with my partner's." Age, sex, genetics, fitness, device and metric all differ. A 35 ms RMSSD can be completely healthy for one person and low for another.
Myth: "My Apple Watch HRV is wrong because it's lower than Oura's." Apple has long reported SDNN from short readings across the day, while Oura reports overnight RMSSD. The numbers measure different things [11][13].
Myth: "One low reading means I'm overtrained." Night-to-night variation is normal [17]. Only a sustained drop in your weekly average carries meaning.
Myth: "Readiness and recovery scores are medically validated." In a September 2026 review, cardiologist Eric Topol noted that no prospective or randomized studies link these proprietary scores to health outcomes [29]. Use them as nudges, not verdicts.
When to See a Doctor
HRV from a wearable isn't a diagnostic test, and no single HRV value has been defined as "dangerous." See a doctor promptly if any of the following apply:
- Symptoms alongside low HRV: chest pain or pressure, fainting or near-fainting, shortness of breath at rest, or a racing or pounding heartbeat. Call 911 for chest pain or fainting.
- An irregular rhythm notification or ECG app result suggesting atrial fibrillation, especially if your HRV suddenly looks much higher than usual.
- A sustained drop over 1–2 weeks with a rising resting heart rate and unexplained fatigue, weight loss, fever or night sweats.
- A persistent "Poor" status (well below the normal range for your age) on Garmin, or a baseline consistently far below the age table, if you also have risk factors such as diabetes, high blood pressure or a family history of heart disease.
- Long-lasting low HRV after an infection, especially with exercise intolerance or crashes after exertion. Long COVID patients show lower wearable HRV during daily activities and sleep [31].
If you have known heart disease or take medications that affect heart rate, discuss what your HRV data mean with your cardiologist before using it to guide exercise.
Related Articles on Health Perk
- Oura vs Whoop: which recovery wearable tracks HRV better
- Oura Ring 5 review: sleep, HRV and readiness tracking
- Best devices to track heart rate at home
- Fitness tracker vs smartwatch for health tracking
- Wearable health devices for sleep, focus and recovery
- Why am I always tired during the day?
Frequently Asked Questions
Is 40 a good HRV?
Usually, yes. A 40 ms RMSSD is close to the average for healthy adults aged 25 to 34 in resting ECG studies. It is above average for people over 45, where typical values are 19 to 26 ms. If 40 ms is an overnight reading from a ring or band, compare it with your own baseline. Device night-time values often run higher than daytime ECG norms.
What is a normal HRV by age?
In 5-minute resting ECGs, average RMSSD is about 40 to 43 ms at ages 25 to 34. It is 32 to 35 ms at 35 to 44, 23 to 26 ms at 45 to 54, and about 19 to 21 ms from 55 to 74. The spread is wide: in every decade, the standard deviation is about half the average, so many healthy people sit well above or below it.
What is a dangerously low HRV?
There is no single cutoff for a dangerously low HRV on a consumer wearable. Older clinical research used 24-hour SDNN below 50 ms as a high-risk marker, but that doesn't apply to short or overnight wearable readings. What matters more is a sustained drop from your own baseline, especially with symptoms such as chest pain, fainting or breathlessness, which need medical care.
Do men or women have higher HRV?
Differences are small and depend on the metric. In a German study of 1,906 healthy adults, men and women didn't differ significantly in RMSSD or SDNN in any age decade. A meta-analysis of 172 studies found women had lower SDNN but more high-frequency, vagal variability. Women's HRV also shifts 3 to 9% across the menstrual cycle.
Why is my Apple Watch HRV lower than my Oura or Whoop HRV?
Because they measure different things. Apple Watch has long reported SDNN from short readings taken throughout the day and night. Oura and Whoop report RMSSD averaged across sleep, when HRV is usually higher. Apple's Series 12 adds a separate Recovery HRV measure, but Apple hasn't published its formula. Compare each device only with its own history.
How can I increase my HRV?
The approaches with the best evidence are regular aerobic exercise, enough sleep, less or no alcohol, and managing stress. Exercise training raises vagal HRV over weeks, and slow breathing at about 6 breaths per minute raises it during and right after practice. Alcohol lowers overnight HRV in a dose-dependent way, even at low intake. Expect gradual changes, not overnight jumps.
Should I skip training when my HRV is low?
Not after a single low night. Night-to-night variation is common, and there is no universal percentage that separates noise from a real change. If your 7-day average stays below your usual range for two or three days, swap intense sessions for easy ones or rest. Rest completely if low HRV comes with a higher resting heart rate, fever or feeling unwell, because that pattern often precedes illness.
Does alcohol lower HRV?
Yes. In a study of 4,098 Finnish employees, alcohol lowered HRV during the first hours of sleep in a dose-dependent way. HRV-based recovery fell by about 9, 24 and 39 percentage points after low, moderate and high intake. The effect was similar in men and women, and being physically active didn't protect against it.
Medical disclaimer: This article is for general information only and is not a substitute for professional medical advice, diagnosis or treatment. Consumer wearables are not diagnostic devices. Always consult a qualified healthcare provider about symptoms, heart conditions or changes to your exercise program. If you have chest pain, fainting or severe shortness of breath, call 911 or your local emergency number.
References
- Task Force of the European Society of Cardiology and the North American Society of Pacing and Electrophysiology (1996). Heart rate variability: standards of measurement, physiological interpretation and clinical use. Circulation, 93(5), 1043–1065. https://doi.org/10.1161/01.CIR.93.5.1043
Supports: Definitions of time-domain HRV metrics (SDNN, RMSSD), autonomic basis of HRV, requirement to remove ectopic beats and artifacts.
- Shaffer, F., & Ginsberg, J. P. (2017). An Overview of Heart Rate Variability Metrics and Norms. Frontiers in Public Health, 5, 258. https://doi.org/10.3389/fpubh.2017.00258
Supports: RMSSD as the primary time-domain estimate of vagally mediated HRV; 24-hour, short-term and ultra-short-term values are not interchangeable; reproduction of Nunan 2010 norms table.
- Nunan, D., Sandercock, G. R., & Brodie, D. A. (2010). A quantitative systematic review of normal values for short-term heart rate variability in healthy adults. Pacing and Clinical Electrophysiology, 33(11), 1407–1417. https://doi.org/10.1111/j.1540-8159.2010.02841.x
Supports: 44 studies, 21,438 healthy adults; short-term RMSSD 42 ± 15 ms (19–75) and SDNN 50 ± 16 ms (32–93); values lower than Task Force norms.
- Voss, A., Schroeder, R., Heitmann, A., Peters, A., & Perz, S. (2015). Short-term heart rate variability—influence of gender and age in healthy subjects. PLoS One, 10(3), e0118308. https://doi.org/10.1371/journal.pone.0118308
Supports: RMSSD and SDNN means by decade and sex in 1,906 healthy adults (5-minute supine ECG); no significant sex differences in RMSSD or SDNN.
- Umetani, K., Singer, D. H., McCraty, R., & Atkinson, M. (1998). Twenty-four hour time domain heart rate variability and heart rate: relations to age and gender over nine decades. Journal of the American College of Cardiology, 31(3), 593–601. https://doi.org/10.1016/s0735-1097(97)00554-8
Supports: RMSSD falls to 47% of second-decade values by the sixth decade, then stabilizes.
- Natarajan, A., Pantelopoulos, A., Emir-Farinas, H., & Natarajan, P. (2020). Heart rate variability with photoplethysmography in 8 million individuals: a cross-sectional study. The Lancet Digital Health, 2(12), e650–e657. https://doi.org/10.1016/S2589-7500(20)30246-6
Supports: 8,203,261 Fitbit users; HRV declines with age, strong diurnal variation, no meaningful sex difference in RMSSD, physical activity associated with higher HRV.
- Koenig, J., & Thayer, J. F. (2016). Sex differences in healthy human heart rate variability: A meta-analysis. Neuroscience & Biobehavioral Reviews, 64, 288–310. https://doi.org/10.1016/j.neubiorev.2016.03.007
Supports: Women show lower SDNN but greater high-frequency (vagal) power than men across 172 studies.
- de Jager, E., Caulfield, B., Angelidi, E., MacNamee, B., & Holden, S. (2026). Wearable-Derived Heart Rate Variability Across the Menstrual Cycle, Hormonal Contraceptive Use, and Reproductive Life Stages in Females: A Living Systematic Review. Sports Medicine, 56(5), 1153–1173. https://doi.org/10.1007/s40279-025-02388-y
Supports: HRV higher early and lower late in the menstrual cycle (3–9% time-domain differences); lower HRV with hormonal contraception; decline after menopause.
- Apple Inc. (2026). Introducing Apple Watch Series 12, with the all-new Health Sensing System. Apple Newsroom. https://www.apple.com/newsroom/2026/09/introducing-apple-watch-series-12-with-the-all-new-health-sensing-system/
Supports: HRV measured up to 24 times more often; Recovery HRV vs overall HRV; overnight vitals vs personal baseline; 0–10 Readiness score.
- Apple Inc. (2026). Use the Readiness app on Apple Watch. Apple Support. https://support.apple.com/guide/watch/readiness-flx4gnzby346/watchos
Supports: Readiness on Series 12 and Ultra 4 only; vitals baseline requires sleeping with the watch at least 7 of the past 49 nights; score bands.
- Apple Inc. (2026). heartRateVariabilitySDNN. Apple Developer Documentation. https://developer.apple.com/documentation/healthkit/hkquantitytypeidentifier/heartratevariabilitysdnn
Supports: HealthKit HRV type measuring the standard deviation of heartbeat intervals, available since iOS 11 / watchOS 4.
- Apple Inc. (2026). heartRateVariabilityRMSSD. Apple Developer Documentation. https://developer.apple.com/documentation/healthkit/hkquantitytypeidentifier/heartratevariabilityrmssd
Supports: New HealthKit RMSSD data type introduced in iOS and watchOS 27.
- Oura Health (2026). Heart Rate Variability. Oura Member Care. https://support.ouraring.com/hc/en-us/articles/360025441974
Supports: Oura measures HRV during sleep in 5-minute samples and reports the nightly average; compare only against your own trends.
- Garmin Ltd. (2023). Heart Rate Variability Status. Forerunner 265 Series Owner's Manual. https://www8.garmin.com/manuals/webhelp/GUID-F41EAFB3-6CC9-42DE-9C6C-9E358DBB0671/EN-US/GUID-9282196F-D969-404D-B678-F48A13D8D0CB.html
Supports: HRV status from sleep readings; three weeks of data needed; Balanced, Unbalanced, Low and Poor definitions.
- Garmin Ltd. (2024). Understanding the HRV Status on Your Garmin Smartwatch. Garmin Blog. https://www.garmin.com/en-US/blog/fitness/understanding-the-hrv-status-on-your-garmin-smartwatch/
Supports: 3-week baseline; above-baseline HRV can follow a big increase in training ("working overtime to recover").
- Dial, M. B., Hollander, M. E., Vatne, E. A., Emerson, A. M., Edwards, N. A., & Hagen, J. A. (2025). Validation of nocturnal resting heart rate and heart rate variability in consumer wearables. Physiological Reports, 13(16), e70527. https://doi.org/10.14814/phy2.70527
Supports: All tested devices report RMSSD; nightly windows per device; HRV agreement Oura Gen 4 CCC 0.99, Gen 3 0.97, Whoop 0.94, Garmin 0.87, Polar 0.82 (13 adults, 536 nights).
- Bellenger, C. R., Miller, D. J., Halson, S. L., Roach, G. D., & Sargent, C. (2021). Wrist-Based Photoplethysmography Assessment of Heart Rate and Heart Rate Variability: Validation of WHOOP. Sensors, 21(10), 3571. https://doi.org/10.3390/s21103571
Supports: WHOOP Ln RMSSD bias 1.66% vs ECG; coefficient of variation of Ln RMSSD 3–13%.
- Cao, R., Azimi, I., Sarhaddi, F., Niela-Vilen, H., Axelin, A., Liljeberg, P., & Rahmani, A. M. (2022). Accuracy Assessment of Oura Ring Nocturnal Heart Rate and Heart Rate Variability in Comparison With Electrocardiography in Time and Frequency Domains: Comprehensive Analysis. Journal of Medical Internet Research, 24(1), e27487. https://doi.org/10.2196/27487
Supports: Oura Ring measured nocturnal heart rate and RMSSD accurately vs ECG in 35 adults.
- Hernando, D., Roca, S., Sancho, J., Alesanco, Á., & Bailón, R. (2018). Validation of the Apple Watch for Heart Rate Variability Measurements during Relax and Mental Stress in Healthy Subjects. Sensors, 18(8), 2619. https://doi.org/10.3390/s18082619
Supports: Apple Watch RR intervals showed very good reliability (>0.9) vs Polar H7 in 20 volunteers; time-domain HRV unaffected by gaps.
- Pietilä, J., Helander, E., Korhonen, I., Myllymäki, T., Kujala, U. M., & Lindholm, H. (2018). Acute Effect of Alcohol Intake on Cardiovascular Autonomic Regulation During the First Hours of Sleep in a Large Real-World Sample of Finnish Employees: Observational Study. JMIR Mental Health, 5(1), e23. https://doi.org/10.2196/mental.9519
Supports: 4,098 adults; dose-dependent HRV suppression; recovery down 9.3, 24.0 and 39.2 percentage units; similar in both sexes and active people.
- Hirten, R. P., Danieletto, M., Tomalin, L., et al. (2021). Use of Physiological Data From a Wearable Device to Identify SARS-CoV-2 Infection and Symptoms and Predict COVID-19 Diagnosis: Observational Study. Journal of Medical Internet Research, 23(2), e26107. https://doi.org/10.2196/26107
Supports: Apple Watch SDNN circadian patterns changed in the 7 days before COVID-19 diagnosis.
- Zhang, S., Niu, X., Ma, J., Wei, X., Zhang, J., & Du, W. (2025). Effects of sleep deprivation on heart rate variability: a systematic review and meta-analysis. Frontiers in Neurology, 16, 1556784. https://doi.org/10.3389/fneur.2025.1556784
Supports: Sleep deprivation significantly lowers RMSSD (11 RCTs, 549 participants).
- Kim, H. G., Cheon, E. J., Bai, D. S., Lee, Y. H., & Koo, B. H. (2018). Stress and Heart Rate Variability: A Meta-Analysis and Review of the Literature. Psychiatry Investigation, 15(3), 235–245. https://doi.org/10.30773/pi.2017.08.17
Supports: Psychological stress is most often associated with lower parasympathetic HRV (37 studies).
- Sandercock, G. R., Bromley, P. D., & Brodie, D. A. (2005). Effects of exercise on heart rate variability: inferences from meta-analysis. Medicine & Science in Sports & Exercise, 37(3), 433–439. https://doi.org/10.1249/01.mss.0000155388.39002.9d
Supports: Exercise training increases vagal HRV (HF power, d = 0.48) across 13 studies.
- Laborde, S., Allen, M. S., Borges, U., et al. (2022). Effects of voluntary slow breathing on heart rate and heart rate variability: A systematic review and a meta-analysis. Neuroscience & Biobehavioral Reviews, 138, 104711. https://doi.org/10.1016/j.neubiorev.2022.104711
Supports: Slow breathing increases vagally mediated HRV during, immediately after, and after multi-session practice (223 studies).
- Plews, D. J., Laursen, P. B., Stanley, J., Kilding, A. E., & Buchheit, M. (2013). Training adaptation and heart rate variability in elite endurance athletes: opening the door to effective monitoring. Sports Medicine, 43(9), 773–781. https://doi.org/10.1007/s40279-013-0071-8
Supports: Use of averaging techniques for daily HRV monitoring; in elite athletes both increases and decreases in HRV can accompany negative adaptation.
- Manresa-Rocamora, A., Sarabia, J. M., Javaloyes, A., Flatt, A. A., & Moya-Ramón, M. (2021). Heart Rate Variability-Guided Training for Enhancing Cardiac-Vagal Modulation, Aerobic Fitness, and Endurance Performance: A Methodological Systematic Review with Meta-Analysis. International Journal of Environmental Research and Public Health, 18(19), 10299. https://doi.org/10.3390/ijerph181910299
Supports: HRV-guided training improves vagal HRV (SMD 0.50) with small, non-significant fitness and performance advantages; rolling averages for daily decisions.
- Hillebrand, S., Gast, K. B., de Mutsert, R., et al. (2013). Heart rate variability and first cardiovascular event in populations without known cardiovascular disease: meta-analysis and dose-response meta-regression. Europace, 15(5), 742–749. https://doi.org/10.1093/europace/eus341
Supports: Low HRV associated with 32–45% higher risk of a first cardiovascular event (8 studies, 21,988 participants).
- Topol, E. (2026). The Big Holes in Wearable Heart Rate Variability And Readiness Scores. Ground Truths. https://erictopol.substack.com/p/the-big-holes-in-wearable-heart-rate
Supports: September 19, 2026 commentary; HRV is a surrogate marker without established causality; no prospective or randomized studies link readiness scores to health outcomes.
- WHOOP (2026). Normal HRV Range by Age and Gender. The Locker. https://www.whoop.com/us/en/thelocker/normal-hrv-range-age-gender/
Supports: WHOOP member data: middle 50% of 25-year-old men roughly 50–100 ms vs about 35–60 ms at 45 (company data, overnight RMSSD).
- Ruijgt, T. M., Slaghekke, A., Ellens, A., Janssen, K. W., & Wüst, R. C. I. (2026). Wearable Heart Rate Variability Monitoring, Autonomic Dysfunction and Post-exertional Malaise in Long COVID: An Observational Study. Sports Medicine. https://doi.org/10.1007/s40279-026-02487-4
Supports: Lower wearable HRV during daily activities and sleep in 121 long COVID patients vs healthy controls.
Frequently Asked Questions
Is 40 a good HRV?
Usually, yes. A 40 ms RMSSD is close to the average for healthy adults aged 25 to 34 in resting ECG studies. It is above average for people over 45, where typical values are 19 to 26 ms. If 40 ms is an overnight reading from a ring or band, compare it with your own baseline. Device night-time values often run higher than daytime ECG norms.
What is a normal HRV by age?
In 5-minute resting ECGs, average RMSSD is about 40 to 43 ms at ages 25 to 34. It is 32 to 35 ms at 35 to 44, 23 to 26 ms at 45 to 54, and about 19 to 21 ms from 55 to 74. The spread is wide: in every decade, the standard deviation is about half the average, so many healthy people sit well above or below it.
What is a dangerously low HRV?
There is no single cutoff for a dangerously low HRV on a consumer wearable. Older clinical research used 24-hour SDNN below 50 ms as a high-risk marker, but that doesn't apply to short or overnight wearable readings. What matters more is a sustained drop from your own baseline, especially with symptoms such as chest pain, fainting or breathlessness, which need medical care.
Do men or women have higher HRV?
Differences are small and depend on the metric. In a German study of 1,906 healthy adults, men and women didn't differ significantly in RMSSD or SDNN in any age decade. A meta-analysis of 172 studies found women had lower SDNN but more high-frequency, vagal variability. Women's HRV also shifts 3 to 9% across the menstrual cycle.
Why is my Apple Watch HRV lower than my Oura or Whoop HRV?
Because they measure different things. Apple Watch has long reported SDNN from short readings taken throughout the day and night. Oura and Whoop report RMSSD averaged across sleep, when HRV is usually higher. Apple's Series 12 adds a separate Recovery HRV measure, but Apple hasn't published its formula. Compare each device only with its own history.
How can I increase my HRV?
The approaches with the best evidence are regular aerobic exercise, enough sleep, less or no alcohol, and managing stress. Exercise training raises vagal HRV over weeks, and slow breathing at about 6 breaths per minute raises it during and right after practice. Alcohol lowers overnight HRV in a dose-dependent way, even at low intake. Expect gradual changes, not overnight jumps.
Should I skip training when my HRV is low?
Not after a single low night. Night-to-night variation is common, and there is no universal percentage that separates noise from a real change. If your 7-day average stays below your usual range for two or three days, swap intense sessions for easy ones or rest. Rest completely if low HRV comes with a higher resting heart rate, fever or feeling unwell, because that pattern often precedes illness.
Does alcohol lower HRV?
Yes. In a study of 4,098 Finnish employees, alcohol lowered HRV during the first hours of sleep in a dose-dependent way. HRV-based recovery fell by about 9, 24 and 39 percentage points after low, moderate and high intake. The effect was similar in men and women, and being physically active didn't protect against it.